Black-Scholes model: greeks
:: Delta of an option ::
- Derivative of the option price with respect to the stock price.
- For a call option on a stock that does not pay dividends, it equals N(d1)
- In the derivation of the Black-Scholes formula it is the number of stocks which we buy to hedge one option that we had written
- This hedging is called delta hedging.
:: Exercises (1) ::
-
How many stocks we need in our portfolio, if
- we sold 1000 call options with strike price 25 USD and expiration in 1/2 year,
- we sold 1000 put options with strike price 20 USD a expiration in 1/4 year
- we bought 1000 call options with strike price 30 USD and expiration in 1 year,
- we bought 1000 put options with strike price 20 USD and expiration in 1 month,
- The following graph shows deltas of three call options as function of the stock price. These options have different time remaining to their maturity:
1 day, 1/2 year, 2 years. Remaining parameters are the same. Add the maturities to corresponding deltas.
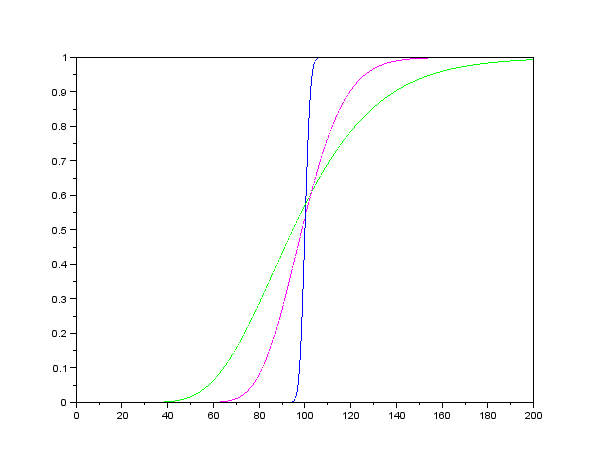
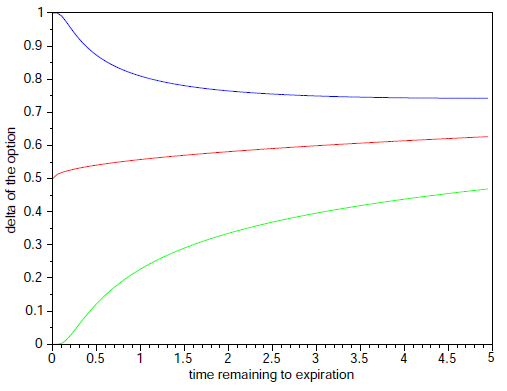
- What is the limit of the delta, as time remaining to expiration appoaches zero as as it approaches infinity? Based on the plot and interpretation of a delta formulate a hypothesis and prove it.
-
Delta of simple derivatives
- What are the solutions to the Black-Scholes PDE which satisty the terminal condition S and the terminal condition c (where c is a constant)? What are their deltas and what is the interpretation of these results?
- Consider the Black-Scholes PDE if the underlying stock pays continuous dividends. What is - in this case - solution to the PDE satisfying the terminal condition S and the corresponding delta? Give a financial interpretation.
:: Exercises (2) - another measure of sensitivity ::
- Example for the lectures: dependence of delta on volatility, topic Black-Scholes III, slide 15
- Graphically show the dependence of delta on volatility for different options.
- Explicitly calculate DdeltaDvol and determine its sign. What can be expected for the option which is "deep out of the money", as mentioned in the cited paper? Compare with numerical computations and graph.
:: Practice problems ::
- Delta of a put option. Compute delta for a put option. Plot a graph of its dependence on the stock price. Explain this graph - sign, monotonicity, behaviour for time close to maturity.
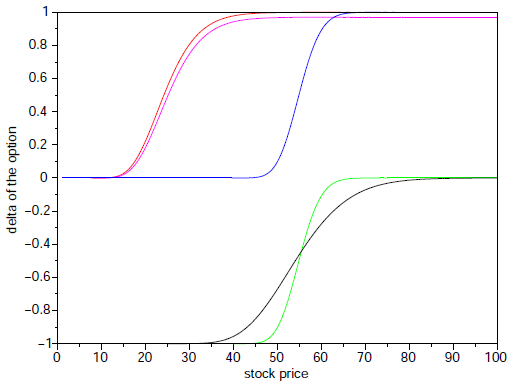
- The following graph shows deltas of four options as functions of the underlying stock price:
call option with E=30, put option with E=30, call option with E=60, put option with E=60. The remaining parameters are constant.
Add the options to their deltas.
- Example from the lecture: "cash or nothing" option, topic Black-Scholes III, slides 12-14
- Derive the price of this option in the Black-Scholes model
- Consider another sensitivity measure - dependence of the option on time (factor theta). Derive the formula for this factor, show it in a graph (as a function of stock price, for a couple of times to maturity) and give an interpretation of its behaviour.
- Consider an option which pays 1 USD if, at the time of expiration, the stock price is between two predetermined values E1 and E2 (otherwise its payoff is zero).
- Compute the Black-Scholes price of this option. Hint: Use the formula for a cash-or-nothing option.
- Compute delta of this option and plot its graph as a function of the stock price. Repeat for different times to maturity. What is the behaviour for time close to maturity and why?
Financial derivatives - exercises, 2014
Beáta Stehlíková, FMFI UK Bratislava
E-mail: stehlikova@pc2.iam.fmph.uniba.sk
Web: http://www.iam.fmph.uniba.sk/institute/stehlikova/
Beáta Stehlíková, FMFI UK Bratislava
E-mail: stehlikova@pc2.iam.fmph.uniba.sk
Web: http://www.iam.fmph.uniba.sk/institute/stehlikova/