Leland model (modelling transaction costs)
:: Leland model (modelling transaction costs) ::
- Leland model (Hayne E. Leland: Option Pricing and Replication with Transactions Costs, 1985)
- Bid and ask price of the stock: Sbid, Sask - we define
- S=(Sbid + Sask)/2
- c=(Sask - Sbid)/S
- Transaction costs for one transaction: (c/2)S
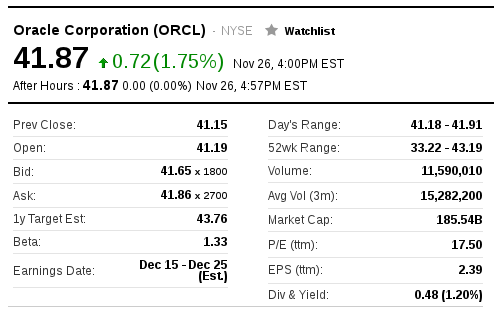
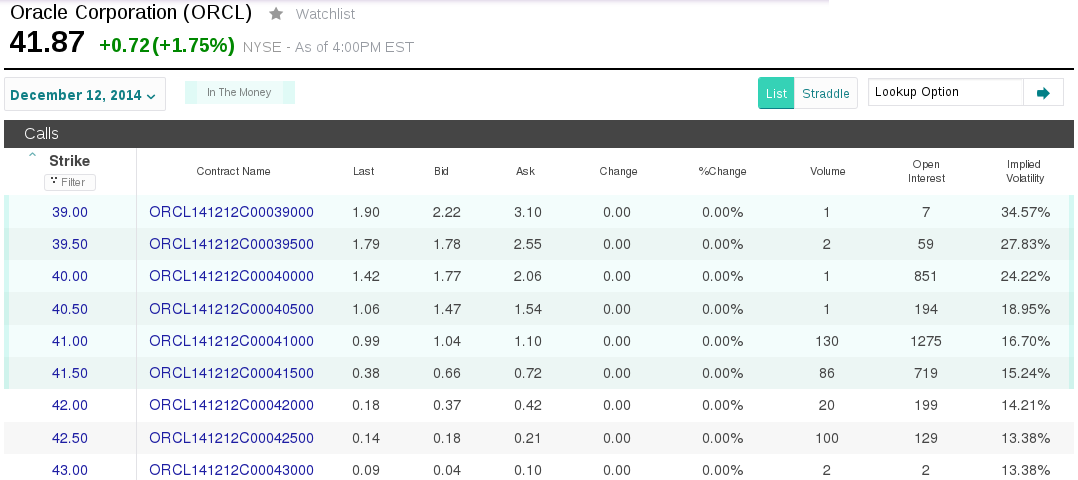
- What is the value of c in practice? Compute its value from the following data:
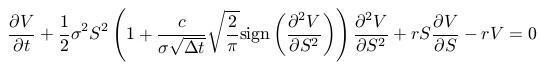
- PDE for the derivatives prices:
- Portfolio in the Black-Scholes model: 1 option,
 stocks (determined by delt hedging), continuous trading
- In the presence of transaction costs: 1 option, stocks (determined by delt hedging), we adjust the portfolio in the intervals of length
 , number of transactions is
- Change of the portfolio value:
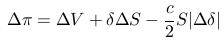
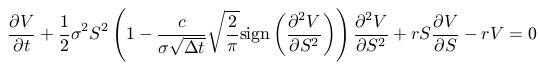
- We have obtained the PDE:
- Portfolio in the Black-Scholes model: 1 option,
- For call and put options:
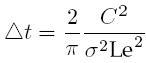
- We define Leland number
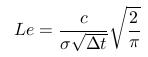
- Leland number has to be from the interval (0,1), then we obtain the price of a call/put option by using the Black-Scholes formula with adjusted
volatility:
- We define Leland number
:: Exercises (1) ::
- Write a function which computed the value of Leland number (imput parameters are: stock volatility, constant ,c
characterizing transaction costs, interval between two adjustments of
the portfolio). Check, for selected value of the parameters, whether
they are feasible, i.e., whether the Leland number is from the interval (0,1).
-
Compute, for feasible values of the parameters, prices of options. The
parameters are: stock price, strike price, volatility, time to
expiration, interest rate, constant c, interval between two
adjustments of the portfolio. Write a function which compute the option
value for these input parameters.
- Choose parameters of the option and the underlying stock, and the interest rate - all the input parameters except for the interval between two adjustments of the portfolio. Plot a graph of Leland function as a function of this interval between two adjustments of the portfolio. What times are feasible? Compute option prices for some of them and compare them with the Black-Scholes price. What it the effect of the interval between two adjustments of the portfolio on the option price?
:: Modelling bid-ask spreads in the Leland model ::
- Price from the previous section can be seen as the bid price.
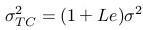
- If we want to derive the ask price, we condider the portfolio with minus one option. In the same way we obtain:
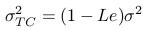
- Call/put option price can be again computed using the Black-Scholes formula, the adjusted volatility is:
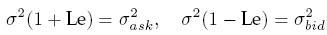
- this means that adjusted volatilities are:
and the difference between ask and bid price is:

- There results enable us to estimate model parameters from the data:
- We compute implied bid a ask volatilities
 and
and  from bid aks ask prices of the option:

- We solve the system of eqution to obtain the parameters
 (implied volatility), Le:
- From the bid and ask prices of the stock we compute the constant c.
- Finally, we compute the implied time between two adjustments of the portfolio when hedging the option:
- We compute implied bid a ask volatilities
:: Exercises (2) ::
-
Use the algorithm above to compute the implied parameters using the
following data for ACN options (choose some of these options). The data
come from the time before opening the stock exchange on 28 November
2014.
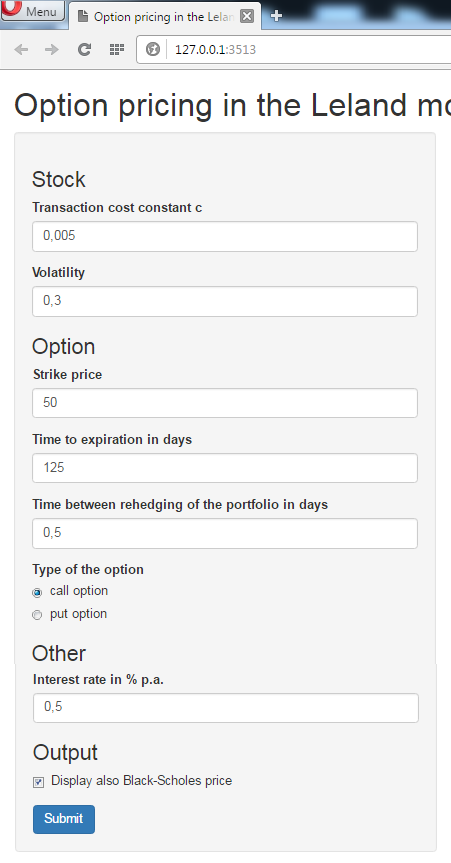
:: Shiny application ::
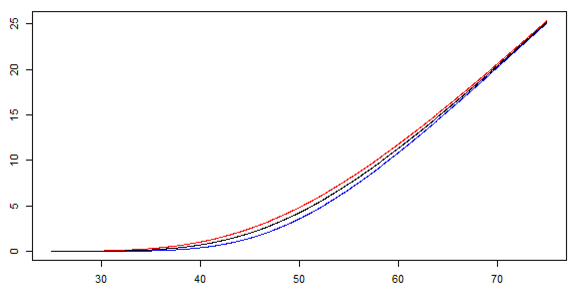
We create a shiny application in R which, for the given parameter values, plot a graph of bid and ask prices of the option. Alternatively, the plot contains also the Black-Scholes price (i.e, the price without transaction costs, if the other parameters stay the same.-
The side panel:
The output - displayed in the main panel - will be:
-
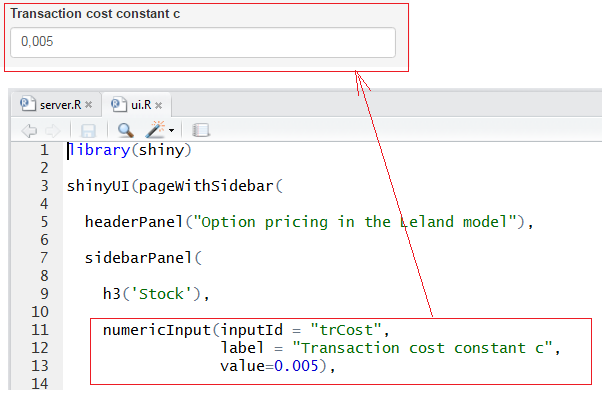
We start with the side panel in the ui.R (user interface) file. We already know how to write headings, but in our previous application (payoffs of option strategies) we have slider inputs. Here we have:
- Numeric input, for example:
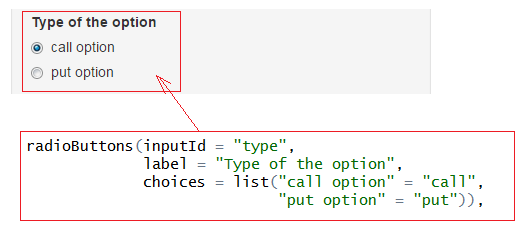
- Radio button, which allows us to choose exactly one of the proposed possibilities:
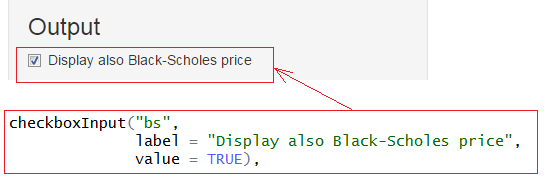
- Checkbox, which we can check or not:
- Numeric input, for example:
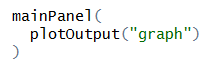
- The output is the graph, so this specification closes the user interface file:
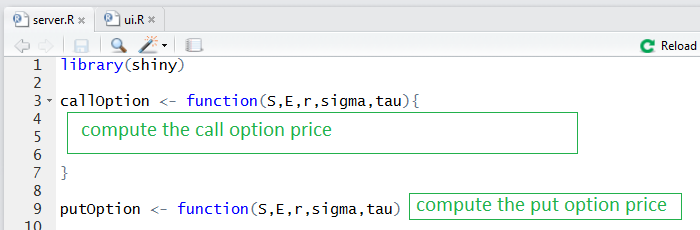
- Now, we move on and write the server.R part. Firstly, write the function for computation of call and put option prices:
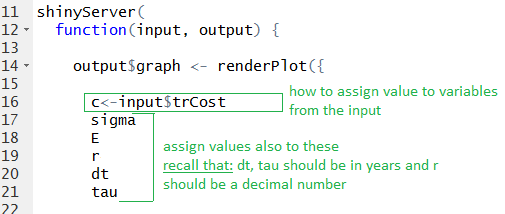
- We need to set the values of variables based on the input. Set the values of the following variables:
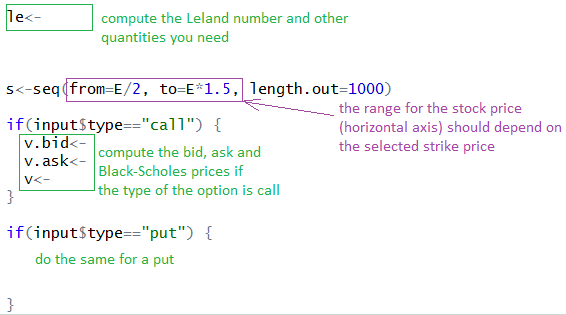
- Compute the values of the vectors of prices which we are going to plot:
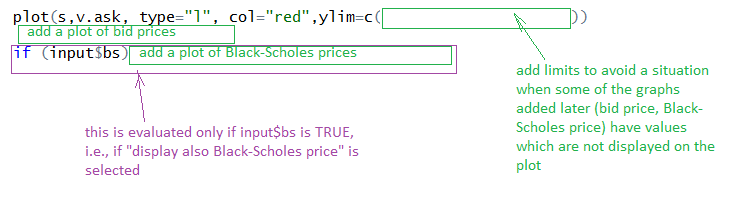
- And, finally, plot them:
- Now, we can run the application.
:: Practice problems ::
- Implied parameters in Leland model for put option. The algorithm is the same, we only need to compute implied Black-Scholes volatility for a put option.
Do this computation for a selected ACN option (they also come from 28 November 2014).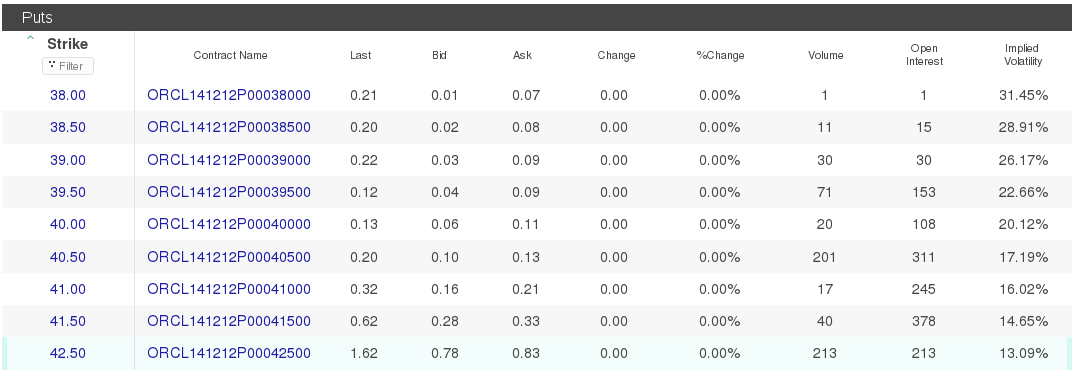
-
Consider transaction costs according to the Leland model. Suppose that
the difference between ask and bid price of a stock equals to half
percent of their average value. Volatility of the stock is 0.5 and its
price today is 140 USD. Interest rate is 0.5 percent. Consider a call
option with exercise price 150 USD and expiration in 1/4 years. Find all
feasible time intervals between two changes of the hedging portfolio.
Then, select one of them and compute bid and ask prices of the given
option.
- Consider the difference between bid and ask price of an option as a function of the stock price S. (The remaining parameters - stock volatility, parameter c from the transaction costs, interest rate, strike price, expiration time - are constant).
- Graphically display this differece for selected sets of parameters.
- When is this difference maximal? Analytically derive the stock price for which this maximum is attained (for general values of parameters).
Financial derivatives - exercises
Beáta Stehlíková, FMFI UK Bratislava
E-mail: stehlikova@pc2.iam.fmph.uniba.sk
Web: http://www.iam.fmph.uniba.sk/institute/stehlikova/
Beáta Stehlíková, FMFI UK Bratislava
E-mail: stehlikova@pc2.iam.fmph.uniba.sk
Web: http://www.iam.fmph.uniba.sk/institute/stehlikova/